Project
Home Interests Photo Album Favorites Project


Engineering Design Workshop 1

 Elijan Avdic

1.2.1                                                       Tension Test

Tension is created when a structural member is pulled on both sides. This will cause the member to stretch increasing the length while the cross sectional area decreases.

            The experiment was done with a measured length of 12 and 18 in piece of rubber. The one end of the rubber were suspended up by clamps on a stand while a weight holder was connected to the other end. The rubber was subjected to tension by placing 2 – 6 lb. weights at 1 lb increments. The experiment tested tension at 12in and 18in lengths and 3/16 in and doubling the rubber to make 3/8 in thickness.


Area =     D  /4     in      =   0.028 in

Modulus of Elasticity of Rubber = 350

Length = 12 in

Diameter = 3/16

Load

Measured Elongation

Stress

Strain

Theoretical Elongation

    P=mg/gc

           L

        =F/A

         =   L/Lo

     L=PLo/AE

          2

        1.5

          25

        1.208

       2.45

          3

        3.5

          39

        1.292

       3.67

          4

          5

          52

        1.417

       4.90

          5

        7.5

          65

        1.625

       6.12

          6

         10

          78

        1.833

       7.35


Here


Here the same experiment was done but with 18in length of rubber.

 A = 0.028 in

E = 350

L = 18 in

D = 3/16

Load

Measured Elongation

Stress

Strain

Theoretical Elongation

    P=mg/gc

           L

        =F/A

         =   L/Lo

     L=PLo/AE

          2

        2.5

          25

        1.138

      2.34

          3

        6.5

          39

        1.361

       3.51

          4

          7

          52

        1.38

       4.68

          5

        9.5

          65

        1.527

       5.89

          6

       13.5

          78

        1.75

       7.01


            The third part of                

                    The third part of the tension test was done with a 12in length but with the thicker cross sectional area at 3/8in.


A = 0.110 in

E = 350

L = 12 in

D = 3/8


Load

Measured Elongation

Stress

Strain

Theoretical Elongation

    P=mg/gc

           L

        =F/A

         =   L/Lo

     L=PLo/AE

          2

        1.5

          25

        1.208

      1.56

          3

        3.5

          39

        1.292

       2.34

          4

          5

          52

        1.417

       3.12

          5

        7.5

          65

        1.625

       3.90

          6

         10

          78

        1.833

       4.68


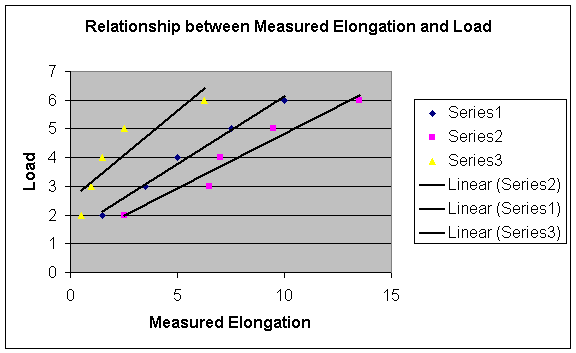
            This graph                      This graph shows the relationship between the applied loads and the measured elongation. The points are also compared to a trend line or linear line.


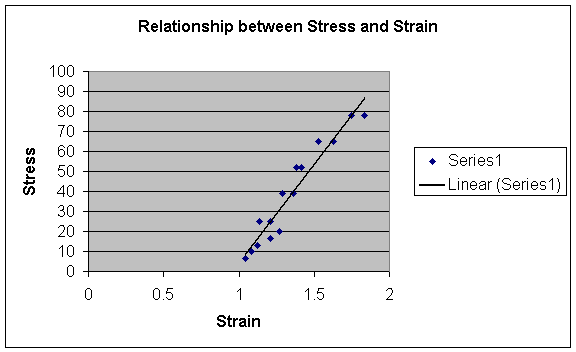
            This graph shows the relationship between stress and strain. It also includes a linear line for comparison.


1.2.2                                          Compression Test

When a column is compressed, forces are acting on its ends pushing inward. As a result the length of the member will decrease.

            For the first case, we took a rubber stopper and crushed it with a vise clamp. The result was the rubber compressed by getting shorter in length and wider in cross sectional area.

            In the second case, we used rulers to apply a force on it until it began to bend. A platform scale was placed under the ruler to measure the weight of the force applied.


Euler’s column formula   Pcr =     EI/L

Modulus of Elasticity = 400,000

B = breadth

H = depth

I = BH /L2

L = Length


Ruler 1

B = 1.25                                              I = 0.0000397

H =  0.0625                                         Pcr = 1.004

L = 12.5

Load = 1.75 lb


Ruler 2

B = 1.5                                                            I = 0.000122

H =  0.01325                                       Pcr = 3.082

L = 36

Load =  0.75


Ruler 3

B = 1.5                                                            I = 0.000488

H =  0.01325                                       Pcr = 12.337

L = 15.5

Load = 1.5
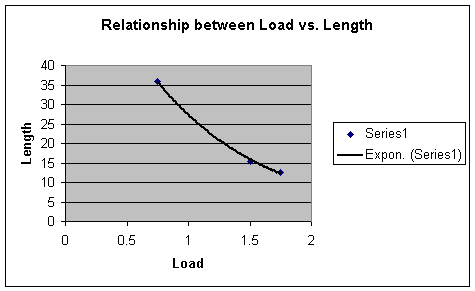


The relationship is that the longer the length, the lower the load that it can take before buckling. The graph is a curve because the shorter the member the less buckling occurs. Steel would be the best material against buckling because it would need a lot of force to force it to buckle. Wood on the other hand cannot take a lot of force because it would just crack or break off.


  1.2.3                                      Bending of  Wooden Beam

A beam is a structural member that can carry perpendicular loads, which cause the member to bend.

            We did this in our experiment by placing a 3ft wooden beam with each end on a platform scale. The scales were then zeroed to neglect the weight of the beam itself. Various weights were placed at various lengths of the beam. The weight was read of the scales to determine the weight distribution at each end of the beam.


  =  PL /48EI

E = 15000

L = 3

I1 = WT /12  =   0.0352

I2 = W T/12  =   0.0625


          2

           4

            6

            8

            9

       0.4375

      0.525

       0.525

       0.575

      0.610

       0.510

      0.625

       0.675

       0.710

      0.725


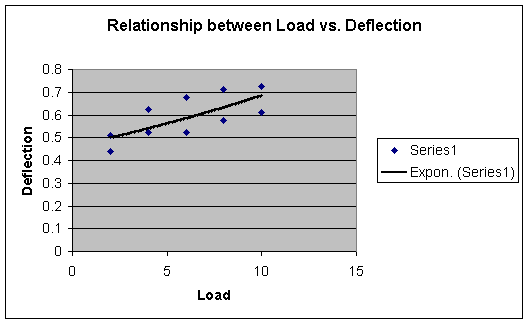
            The graph shows that with more weight there will be more and equal deflection. The points on the graph are very close to a linear line.

 
2.3.1                                                     Moments of Forces

Equilibrium of a structured is obtained when there are equal forces applied at equal points from the center of rotation of a member. This is to say that the farther a force is away from the center with no equal and opposite force, the more the member will likely rotate about the center.


            A

             B

                P1

              P2

            9in

            6in

                1lb

            1.5lb

           18in

            9in

                1lb

             2lb

            6in

            9in

              1.5lb

              1lb


            This shows that the relationship between distance and weight is that the closer to center the more weight is needed to keep it balanced.

 
                      2.3.2                                                      End reactions of a Loaded Beam

                    The end reactions are the supports of a structural beam. Forces that are applied to the beam and their position all affect the end reactions or joints of a beam.

                     A beam was placed on top of platform scales on each end. Weights were then put on the beam at various points. A reading of the scale was done every time to see how the weight was distributed along the beam.

                     This table shows the relationship of weight and the distribution at each end of the beam.


             A

             B

             P1

              P2

           3.5lb

         0.5lb

           0.75ft

          2.25ft

         3.125lb

       0.875lb

             1ft

             2ft

          2.75lb

        1.25lb

           1.25ft

          1.75ft


                      2.3.3                                                       Internal Forces in Truss Members

                     A truss is formed with several structural members joined in with the same joints to form a stable structure such as a truss bridge.

                     This experiment was done with pieces of rubber suspended by force gauges that were connected to a stand. The bottom ends of the rubber was connected to a weight holder. A 2lb weight was added to the holder and a measurement of the force gauges and of the length of the rubber under tension was taken.


                1

                 2

                 P

                Q

               20

                25

                14in

               14in

               30

                20

                14in

               12in

               40

                20

                14in

               10in


            This experiment  shows that the shorter the structural member the more force there was acting upon it. Similarly, the longer the member the less force there was acting on it.